Generating Line Flux Maps
import numpy as np

from astropy.coordinates import SkyCoord
from astropy import units as u
from astropy import wcs

import matplotlib.pyplot as plt

from hetdex_tools.interpolate import make_narrowband_image
from hetdex_tools.phot_tools import fit_circular_aperture
%matplotlib inline
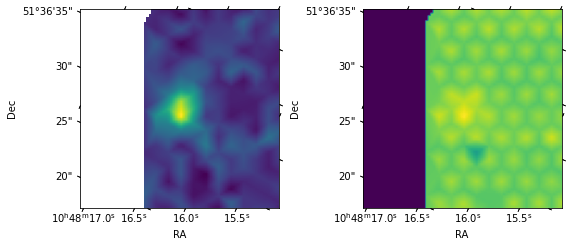
Make a collapased wavelength image at the line detection wavelength and coordinate
detectid=3002617964
hdu= make_narrowband_image(
    detectid=detectid,
    include_error=True,
    pixscale=0.25*u.arcsec,
    imsize=20.*u.arcsec,
    convolve_image=False,
    apply_mask=True,
    interp_kind='linear',
    fill_value=0.0, #defaults to np.nan
)
im = hdu[0].data
error = hdu[1].data
w = wcs.WCS(hdu[0].header)
plt.figure(figsize=(8, 4))
plt.subplot(121, projection=w)
plt.imshow(im)
plt.xlabel("RA")
plt.ylabel("Dec")

plt.subplot(122, projection=w)
plt.imshow(error)
plt.xlabel("RA")
plt.ylabel("Dec")
plt.tight_layout()
coords = SkyCoord( ra = hdu[0].header['CRVAL1']*u.deg, dec=hdu[0].header['CRVAL2']*u.deg)
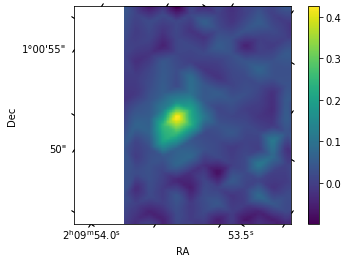
Make a collapased wavelength image at a user defined position and wavelength
# Example for detectid = 3011087780
hdu = make_narrowband_image(coords=SkyCoord(ra=32.471451, dec=1.012042, unit='deg'),
                            wave_range = [4857.34 - 20, 4857.34 + 20], # central wave=4857.32A
                            shotid = 20210105014,
                            include_error=True,
                            imsize=20.*u.arcsec,
                            convolve_image=False,
                            survey='pdr1',
                            apply_mask=True,
                           fill_value=0.0)
im = hdu[0].data
w = wcs.WCS(hdu[0].header)
plt.subplot(111, projection=w)
plt.imshow(im)
plt.xlabel("RA")
plt.ylabel("Dec")
plt.colorbar()
<matplotlib.colorbar.Colorbar at 0x153800064940>
coords = SkyCoord( ra = hdu[0].header['CRVAL1']*u.deg, dec=hdu[0].header['CRVAL2']*u.deg)
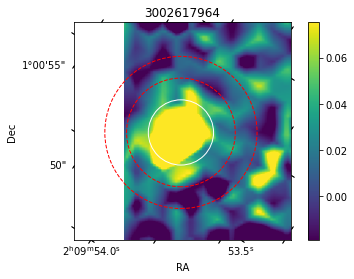
Fit a circular aperture to the detection to get the line image S/N relative to sky background in an annulus around the detection
flux, flux_err, bkg_stddev, apcor = fit_circular_aperture(hdu, coords,
                                                          radius=3*u.arcsec,
                                                          annulus=[5,7]*u.arcsec,
                                                          plot=True, plottitle=str(detectid))
print('Signal-to-noise in circular aperture is {:5.3f}'.format(flux/bkg_stddev))
Signal-to-noise in circular aperture is 7.758
To save the datacube:
hdu.writeto('{}_line_flux_map.fits'.format(detectid), overwrite=True)
For make_narrowband_image Options:
help(make_narrowband_image)
Help on function make_narrowband_image in module hetdex_tools.interpolate:

make_narrowband_image(detectid=None, coords=None, shotid=None, pixscale=<Quantity 0.25 arcsec>, imsize=<Quantity 30. arcsec>, wave_range=None, convolve_image=False, ffsky=False, subcont=False, dcont=50.0, include_error=False, survey='hdr4', extract_class=None, fiber_flux_offset=None, interp_kind='linear', apply_mask=False, fill_value=nan)
    Function to make narrowband image from either a detectid or from a
    coordinate/shotid combination.

    Paramaters
    ----------
    detectid: int
        detectid from the continuum or lines catalog. Default is
        None. Provide a coords/shotid combo if this isn't given
    coords: SkyCoords object
        coordinates to define the centre of the data cube
    pixscale: astropy angle quantity
         plate scale
    imsize: astropy angle quantity
        image size
    wave_range: list or None
        start and stop value for the wavelength range in Angstrom.
        If not given, the detectid linewidth is used
    convolve_image: bool
        option to convolve image with shotid seeing
    ffsky: bool
        option to use full frame calibrated fibers. Default is
        True.
    subcont: bool
        option to subtract continuum. Default is False. This
        will measure the continuum 50AA below and above the
        input wave_range
    dcont
        width in angstrom to measure the continuum. Default is to
        measure 50 AA wide regions on either side of the line
    include_error bool
        option to include error array
    extract   Extract class object
        option to include a preloaded Extract class object.
        Default is to load extract class according to detection info
    fiber_flux_offset: 1036 array
        array of values in units of 10**-17 ergs/s/cm2/AA to add
        to each fiber spectrum used in the extraction. Defaults
        to None
    interp_kind: str
        Kind of interpolation to pixelated grid from fiber intensity.
        Options are 'linear', 'cubic', 'nearest'. Default is linear.
    apply_mask: bool
        Apply HETDEX fiber mask model. This will mask all fibers contributing
        to the spectral extraction before summation. Masked in place as NaNs
    fill_value: float, optional
        Value used to fill in for requested points outside of coverage or in a mask
        region. If not provided, then the default is nan.

    Returns
    -------
    hdu: PrimaryHDU object
        the 2D summed data array and associated 2d header
        Units are '10^-17 erg cm-2 s-1'
        If include_error=True will include addiional hdu

    Examples
    --------

    For a specific detectid:
    >>> hdu = make_narrowband_image(detectid=2101046271)

    For a SkyCoords object. You must provide shotid and
    wavelength range

    >>> coords = SkyCoord(188.79312, 50.855747, unit='deg')
    >>> wave_obj = 4235.84 #in Angstrom
    >>> hdu = make_narrowband_image(coords=coords,
                                    shotid=20190524021,
                                    wave_range=[wave_obj-10, wave_obj+10])